

Latest [Jan 20, 2022] Databricks Databricks-Certified-Professional-Data-Scientist Exam Practice Test To Gain Brilliante Result
Take a Leap Forward in Your Career by Earning Databricks Databricks-Certified-Professional-Data-Scientist
NEW QUESTION 24
Suppose you have made a model for the rating system, which rates between 1 to 5 stars. And you calculated that RMSE value is 1.0 then which of the following is correct
- A. It means that your predictions are on average three star off of what people really think
- B. It means that your predictions are on average two star off of what people really think
- C. It means that your predictions are on average four star off of what people really think
- D. It means that your predictions are on average one star off of what people really think
Answer: D
NEW QUESTION 25
Marie is getting married tomorrow, at an outdoor ceremony in the desert. In recent years, it has rained only 5 days each year. Unfortunately, the weatherman has predicted rain for tomorrow. When it actually rains, the weatherman correctly forecasts rain 90% of the time. When it doesn't rain, he incorrectly forecasts rain 10% of the time. Which of the following will you use to calculate the probability whether it will rain on the day of Marie's wedding?
- A. All of the above
- B. Naive Bayes
- C. Logistic Regression
- D. Random Decision Forests
Answer: B
Explanation:
Explanation
The sample space is defined by two mutually-exclusive events - it rains or it does not rain. Additionally, a third event occurs when the weatherman predicts rain. You should consider Bayes' theorem when the following conditions exist.
* The sample space is partitioned into a set of mutually exclusive events {A1, A2,... :An}.
* Within the sample space, there exists an event B: for which P(B) > 0.
* The analytical goal is to compute a conditional probability of the form: P( Ak B).
NEW QUESTION 26
Which of the following metrics are useful in measuring the accuracy and quality of a recommender system?
- A. Support Vector Count
- B. Cluster Density
- C. Sum of Absolute Errors
- D. Mean Absolute Error
Answer: D
Explanation:
Explanation
The MAE measures the average magnitude of the errors in a set of forecasts, without considering their direction. It measures accuracy for continuous variables. The equation is given in the library references.
Expressed in words, the MAE is the average over the verification sample of the absolute values of the differences between forecast and the corresponding observation. The MAE is a linear score which means that all the individual differences are weighted equally in the average.
The sum of absolute errors is a valid metric, but doesn't give any useful sense of how the recommender system is performing.
Support vector count and cluster density do not apply to recommender systems.
MAE and AUC are both valid and useful metrics for measuring recommender systems.
NEW QUESTION 27
In unsupervised learning which statements correctly applies
- A. Instead of telling the machine Predict Y for our data X, we're asking What can you tell me about X?
- B. It does not have a target variable
- C. telling the machine Predict Y for our data X
Answer: A,B
Explanation:
Explanation
In unsupervised learning we don't have a target variable as we did in
classification and regression.
Instead of telling the machine Predict Y for our data X, we're asking What can you tell me about X?
Things we ask the machine to tell us about
X may be What are the six best groups we can make out of X? or What three features occur together most frequently in X?
NEW QUESTION 28
A denote the event 'student is female' and let B denote the event 'student is French'. In a class of 100 students suppose 60 are French, and suppose that 10 of the French students are females. Find the probability that if I pick a French student, it will be a girl, that is, find P(A|B).
- A. 1/6
- B. 1/3
- C. 2/3
- D. 2/6
Answer: A
Explanation:
Explanation
Since 10 out of 100 students are both French and female, then
P(AandB)=10100
Also. 60 out of the 100 students are French, so
P(B)=60100
So the required probability is:
P(A|B)=P(AandB)P(B)=10/10060/100=16
NEW QUESTION 29
Consider flipping a coin for which the probability of heads is p, where p is unknown, and our goa is to estimate p. The obvious approach is to count how many times the coin came up heads and divide by the total number of coin flips. If we flip the coin 1000 times and it comes up heads 367 times, it is very reasonable to estimate p as approximately 0.367. However, suppose we flip the coin only twice and we get heads both times.
Is it reasonable to estimate p as 1.0? Intuitively, given that we only flipped the coin twice, it seems a bit rash to conclude that the coin will always come up heads, and____________is a way of avoiding such rash conclusions.
- A. Naive Bayes
- B. Linear Regression
- C. Logistic Regression
- D. Laplace Smoothing
Answer: D
Explanation:
Explanation
Smooth the estimates: consider flipping a coin for which the probability of heads is p, where p is unknown, and our goal is to estimate p. The obvious approach is to count how many times the coin came up heads and divide by the total number of coin flips. If we flip the coin 1000 times and it comes up heads 367 times, it is very reasonable to estimate p as approximately 0.367. However, suppose we flip the coin only twice and we get heads both times. Is it reasonable to estimate p as 1.0? Intuitively, given that we only flipped the coin twice, it seems a bit rash to conclude that the coin will always come up heads, and smoothing is a way of avoiding such rash conclusions. A simple smoothing method, called Laplace smoothing (or Laplace's law of succession or add-one smoothing in R&N), is to estimate p by (one plus the number of heads) / (two plus the total number of flips). Said differently, if we are keeping count of the number of heads and the number of tails, this rule is equivalent to starting each of our counts at one, rather than zero. Another advantage of Laplace smoothing is that it avoids estimating any probabilities to be zero, even for events never observed in the data.
Laplace add-one smoothing now assigns too much probability to unseen words
NEW QUESTION 30
Logistic regression is a model used for prediction of the probability of occurrence of an event. It makes use of several variables that may be......
- A. None of the 1 and 2 are correct
- B. Numerical
- C. Categorical
- D. Both 1 and 2 are correct
Answer: D
Explanation:
Explanation
Logistic regression is a model used for prediction of the probability of occurrence of an event. It makes use of several predictor variables that may be either numerical or categories.
NEW QUESTION 31
In which lifecycle stage are appropriate analytical techniques determined?
- A. Data preparation
- B. Discovery
- C. Model building
- D. Model planning
Answer: D
Explanation:
Explanation
In Phase 3, the data science team identifies candidate models to apply to the data for clustering, classifying, or finding relationships in the data depending on the goal of the project, It is during this phase that the team refers to the hypotheses developed in Phase 1, when they first became acquainted with the data and understanding the business problems or domain area. These hypotheses help the team frame the analytics to execute in Phase
4 and select the right methods to achieve its objectives.
Some of the activities to consider in this phase include the following: Assess the structure of the datasets. The structure of the datasets is one factor that dictates the tools and analytical techniques for the next phase.
Depending on whether the team plans to analyze textual data or transactional data, for example, different tools and approaches are required.
Ensure that the analytical techniques enable the team to meet the business objectives and accept or reject the working hypotheses. Determine if the situation warrants a single model or a series of techniques as part of a larger analytic workflow. A few example models include association rules and logistic regression Other tools, such as Alpine Miner, enable users to set up a series of steps and analyses and can serve as a front-end user interface (Ul) for manipulating Big Data sources in PostgreSQL.
NEW QUESTION 32
You are having 1000 patients' data with the height and age. Where age in years and height in meters. You wanted to create cluster using this two attributes. You wanted to have near equal effect for both the age and height while creating the cluster. What you can do?
- A. You will be adding height with the numeric value 100
- B. You will be dividing both age and height with their respective standard deviation
- C. You will be converting each height value to centimeters
- D. You will be taking square root of height
Answer: B,C
Explanation:
Explanation
When you see the data age in years would have values like 50, 60r 70 90 years etc. And while calculating distance from centroid maximum possible value can be 90-0 and its square will be 8100.
While using heights in meter can be 2-0.5(1.5) meters and its square will be 2.25 only. So you can see age has more effect than height. Hence bringing the height on same level you can convert it into centimeters. Can bring data upto 200 centimeters and then it be more effective like square of 200 maximum.
However there is another approach is to divide the each value with its standard deviation, which will not have impact of the units e.g. age/sd of the age, which results in value without unit. This can also help in reducing the effect of units.
NEW QUESTION 33
Which activity is performed in the Operationalize phase of the Data Analytics Lifecycle?
- A. Transform existing variables
- B. Try different variables
- C. Try different analytical techniques
- D. Define the process to maintain the model
Answer: D
Explanation:
Explanation
Operationalize In the final phase, the team communicates the benefits of the project more broadly and sets up a pilot project to deploy the work in a controlled way before broadening the work to a full enterprise or ecosystem of users. In Phase 4. the team scored the model in the analytics sandbox.
NEW QUESTION 34
What is the probability that the total of two dice will be greater than 8, given that the first die is a 6?
- A. 1/3
- B. 1/6
- C. 2/3
- D. 2/6
Answer: C
NEW QUESTION 35
Which analytical method is considered unsupervised?
may have a trend component that is quadratic in nature. Which pattern of data will indicate that the trend in the time series data is quadratic in nature?
- A. K-means clustering
- B. Linear regression
- C. Naive Bayesian classifier
- D. Decision tree
Answer: A
Explanation:
Explanation
kmeans uses an iterative algorithm that minimizes the sum of distances from each object to its cluster centroid, over all clusters. This algorithm moves objects between clusters until the sum cannot be decreased further. The result is a set of clusters that are as compact and well-separated as possible. You can control the details of the minimization using several optional input parameters to kmeans, including ones for the initial values of the cluster centroids, and for the maximum number of iterations.
Clustering is primarily an exploratory technique to discover hidden structures of the data, possibly as a prelude to more focused analysis or decision processes. Some specific applications of k-means are image processing, medical and customer segmentation. Clustering is often used as a lead-in to classification. Once the clusters are identified, labels can be applied to each cluster to classify each group based on its characteristics. Marketing and sales groups use k-means to better identify customers who have similar behaviors and spending patterns.
NEW QUESTION 36
You are working with the Clustering solution of the customer datasets. There are almost 40 variables are available for each customer and almost 1.00,0000 customer's data is available. You want to reduce the number of variables for clustering, what would you do?
- A. You will randomly reduce the number of variables
- B. You will find the correlation among the variables and from their variables are not co-related will be discarded.
- C. You will find the correlation among the variables and from the highly co-related variables, you will be considering only one or two variables from it.
- D. You can combine several variables in one variable
- E. You cannot discard any variable for creating clusters.
Answer: C,D
Explanation:
Explanation
When you are applying clustering technique and you find that there are quite a huge number of variables are available. Then it is better the find the co-relation among the variables and consider only one or two variables from the highly co-related variables. Because highly co-related variable will have the same effect, while creating the cluster. We can use scatter plot matrix among the variables to find the co-relation.
You can also combine several variables into a single variable. For example if you have two values in the dataset like Asset and Debt than by combining these two values like Debt to Asset ratio and use it while creating the cluster.
NEW QUESTION 37
Refer to image below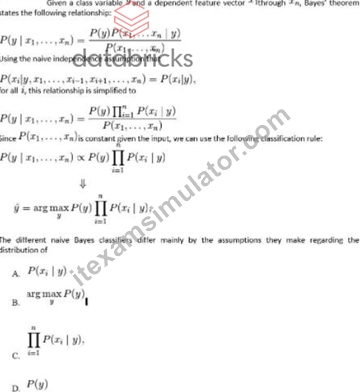
- A. Option C
- B. Option A
- C. Option B
- D. Option D
Answer: B
Explanation:
Explanation
Text Description automatically generated
NEW QUESTION 38 
The figure below shows a plot of the data of a data matrix M that is 1000 x 2. Which line represents the first principal component?
- A. blue
- B. Neither
- C. yellow
Answer: A
Explanation:
Explanation
Principal component analysis (PCA) involves a mathematical procedure that transforms a number of (possibly) correlated variables into a (smaller) number of uncorrelated variables called principal components. The first principal component accounts for as much of the variability in the data as possible, and each succeeding component accounts for as much of the remaining variability as possible.
The first principal component corresponds to the greatest variance in the data. The blue line is evidently this first principal component, because if we project the data onto the blue line, the data is more spread out (higher variance) than if projected onto any other line, including the yellow one.
NEW QUESTION 39
In which of the scenario you can use the linear regression model?
- A. Predicting demand of the goods and services based on the weather
- B. Predicting tumor size reduction based on input as number of radiation treatment
- C. Predicting Home Price based on the location and house area
- D. Predicting sales of the text book based on the number of students in state
Answer: A,B,C,D
Explanation:
Explanation : You can use the linear regression model for predicting the continuous output variable based on the input variables. In all the cases mentioned in the question option, you can see that output can be predicted based on the input variable.
Option-A: Input: Location, House Area and Output: House Price
Option-B : Input: Weather condition, Output: Demand for the goods and services Option-C : Input: Number of Radiation Session Output: Tumor Size Reduction Option-D : Input: Number of students and Output: Sale quantity of text book
NEW QUESTION 40
......
Databricks Databricks-Certified-Professional-Data-Scientist Exam Syllabus Topics:
| Topic | Details |
|---|---|
| Topic 1 |
|
| Topic 2 |
|
| Topic 3 |
|
| Topic 4 |
|
| Topic 5 |
|
| Topic 6 |
|
| Topic 7 |
|
Authentic Best resources for Databricks-Certified-Professional-Data-Scientist Online Practice Exam: https://www.itexamsimulator.com/Databricks-Certified-Professional-Data-Scientist-brain-dumps.html
